Pipeline Corossion and Inspection Methods
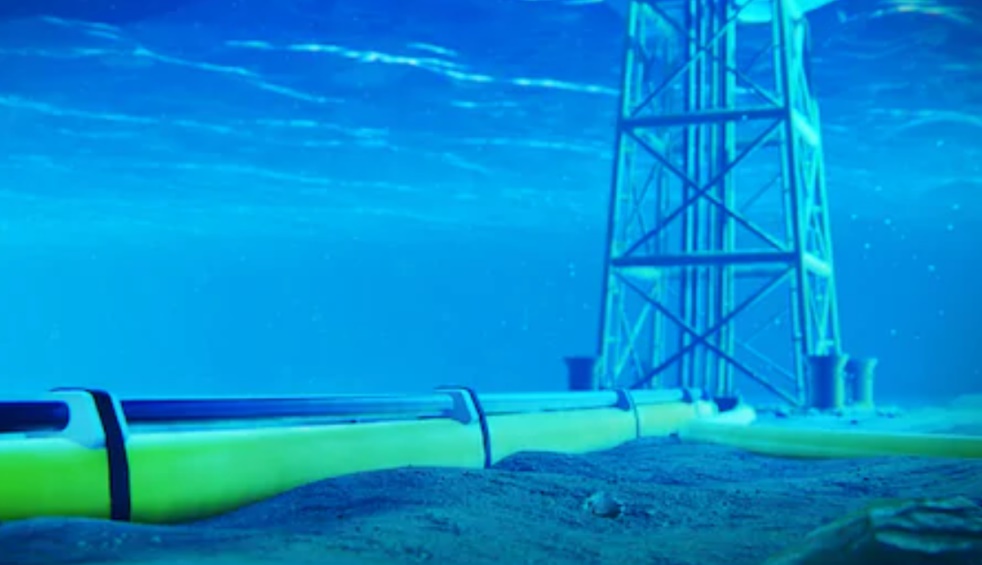
Pipeline Corossion and Inspection Methods
Some Pipeline Inspection Tools are used prior and during the construction and preparation process of the Pipeline, and other inspection methods have a great utility during the pipeline’s function also. We are going to explore in this work both aplicable Pipeline Inspection Methods, through various NDT/NDE inspection methods as well as destructive testing.
Table of Contents:
Abstract ………………………………………………………………………………………………………………….2
Introduction…………………………………………………………………………………………………………………4
The Purpose of The Thesys…………………………………………………………………………………………….4
Chapter I
EXTERNAL CORROSION CONTROL SUBMARINE PIPELINE………..……………………..5
- First Revision………………………………………………………………………………………………………6
- Coating Breakdown Factor……………………………………………………………………………………7
Chapter II
Inline Inspection Methods [ILS] ……………………………………………………………………………………..10
Ultrasonic Corrosion Inspection of Crude Oil Pipeline………………………………………………11
- Magnetic Flux Leaking [MFL] Pipeline Inspection…………………………………………………….15
- EMAT – electromechanical acoustic transducer Inspection Tool………………………………..17
- Eddy Current Corrosion Inspection………………………………………………………………………..20
Conclusion…………………………………………………………………………………………………………………..13
INTRODUCTION
Ever since the first subsea pipelines were installed engineers have been developing methods to inspect, repair and maintain them to ensure that they can safely transport the fluids required. Most of this development has focussed on the areas of saturation diving, remotely operated vehicles and pigging, with the technologies improving incrementally to meet the demands of deeper, hotter and higher pressure pipelines
When a pipeline is built, inspection personnel may use visual, X-ray, magnetic particle, ultrasonic and other inspection methods to evaluate the welds and ensure that they are of high quality. The image to the left show two NDT technicians setting up equipment to perform an X-ray inspection of a pipe weld. These inspections are performed as the pipeline is being constructed so gaining access the inspection area is not problem.
The purpose
In order to assess various types of pipeline identification methods in the offshore industry, we must explore the various ways, and documentation that is required for this purpose. Furthermore, the purpose of this work is to identify Pipeline Inspection Methods, onshore as well as offshore.
Chapter I
EXTERNAL CORROSION CONTROL SUBMARINE PIPELINE
Submarine pipelines are designed with an external coating as the primary system for corrosion control. Still, a CP system is normally provided as a back-up to account for any deficiency of the coating system. In defining the required capacity of the CP system, the detailed design of the applicable pipeline coating systems and the provisions for quality control during their application are consequently the primary factors. There have been significant developments in pipeline coating technology over the last 30 years. The first generation of submarine pipeline coatings based on asphalt and concrete had either poor reinforcement of the two layers or no reinforcement at all and coating of field joints was often performed without specific requirements to quality control of the application.
The coating breakdown factors for pipeline coatings in the 80s and 90s were consequently up to 0.10 at the end of a 30 years design life. Since about 1990, new offshore development concepts, primarily those based on subsea installations for production and for injection of water or gas for pressure control, have led to the use of relatively short and small-to-medium diameter pipelines without need for concrete (anti-buoyancy) coating. Moreover, many of the production lines use thermally insulating coatings based on polypropylene (PP), polyurethane (PU) or some rubber compound. Associated injection lines have typically been installed with a fusion bonded epoxy (FBE) coating; in the North Sea mostly with a PP jacket on top and with an intermediate layer of modified PP as an adhesive, referred to as three-layer polypropylene (3LPP).
New coating systems have also been developed for the purpose of thermal insulation and/or compatibility with reeling operations for pipeline installation. Some of the systems applied offer superior isolation to the environment and hence, with a potential for very low CP current demands. Results from remotely operated vehicle (ROV) inspection of numerous submarine pipelines for lifetime extension projects have shown that the coating is still in good condition after 20-30 years in service and the consumption of the galvanic anodes is much lower than assumed in design. Despite the advanced and improved coating systems, some of the systems may be vulnerable to disbondment due to insufficient quality control of the application process or improper design/application of field joint coatings.
This applies in particular for pipelines installed by reeling for which the field-joint coating (FJC) and adjacent parent coating are vulnerable to damage. Monitoring of CP current demands and anode output for subsea pipelines are rare and thus the actual parameters that are of importance for CP cannot be determined exactly. A section of the Northstar oil pipeline operated by BP Exploration Alaska† was installed with a CP monitoring system to confirm adequate protection.
It has been argued by some corrosion engineers that the electrically insulating properties of polypropylene/polyethylene coating could lead to CP shielding and thus corrosion damage under areas of disbonded coating. For onshore pipelines, corrosion damage beneath disbonded coating is more likely than for subsea pipelines since poor soil resistivity may prevent efficient CP to reach a particular pipeline section.
Even if CP current is capable to reach a section with disbonded coating on an onshore pipeline, the soil/water resistivity may be too high for a protection current to reach the steel area under the disbonded coating whilst the mass transfer of corrosive species (e.g. due to intermittent wet/dry soil exposure) may still be relatively high.
For a narrow crevice with stagnant seawater, the O2-corrosion will be limited by the diffusion of O2 into the crevice whilst the conductivity promoting efficient CP under the coating is high. In seawater the O2 content is only 7 parts-per-million (ppm) and the diffusion coefficient is also much lower than in air. In stagnant conditions (e.g. at a locally FBE-disbonded area) the corrosion will stop when dissolved oxygen has been consumed. The risk for Microbiologically Induced Corrosion (MIC) beneath disbonded coating is also considered low for subsea pipelines with CP. If e.g. Sulfur Reducing Bacteria (SRB) should establish in a crevice formed by disbonded coating, the activity will still be limited by both the diffusion of sulphate ions and/or other electron acceptors into the small gap and the supply of organic matter and nutrients required for the metabolism of the bacteria. This will efficiently retard the SRB activity and the corrosion process. The reduction of water (dominating the cathodic reaction when there is no supply of O2) will result in an alkaline environment (pH> 10) due to the production of OH- and thus limit the corrosion on the steel and slow down or even inhibit the activity of bacteria.
- FIRST REVISION
An initiative to prepare a new DNV Recommended Practice (RP) dedicated to CP of submarine pipelines commenced in mid-2002. The emphasis for a new RP was primarily on transmission lines and flowlines for routing of production or injection fluid over shorter distances (pipelines typically installed by reeling). These pipelines are designed with advanced pipeline coating systems based on e.g. FBE and PE/PP and with stringent requirements to coating design and quality control of coating application. The RP was developed at the same time as the industry gained knowledge of HISC failures of 13Cr pipelines and emphasized the benefits of utilizing CP from anodes on adjacent structures. The following benefits apply when using anodes on adjacent structures such as subsea production templates, riser bases or platform substructures:
• Welding of anodes to the pipe wall can be fully avoided and anodes installed on such structures have a lower cost of manufacture and installation.
• The CP capacity, in terms of both current output (A) and current charge (Ah) is typically higher and the condition of the anodes easier to inspect than for pipeline bracelet anodes which would normally become partly or fully buried in seabed sediments.
• In case any future retrofitting is required, it is more practical for such anodes than for bracelet anodes.
• For linepipe materials susceptible to HISC, there is the additional major benefit that welding operations and damage to the linepipe coating by anode fastening can be completely avoided.
• Quality of FJC is easier to control when there is no interference by any anode fastening devices located to the field joints. To allow flowlines of considerable length (e.g. up to 30 km) to be protected by anodes at adjacent structures, it was necessary to remove any undefined conservatism from the CP design assumptions. This was achieved by the following changes to CP design:
• The CP design life should be equivalent to the expected useful lifetime of the pipeline and current drain to other structures should be avoided, e.g. by installing self-sufficient CP systems on such structures.
• The CP design should presume that measures would be taken to avoid excessive mechanical damage to the coating during operation; e.g. by burial/coverage in areas with third party activities like e.g. trawling
. • Strict requirements to the pipeline coating systems were implemented, including the factory applied linepipe coating, field joint coatings and any field repair systems for the linepipe coating. Such requirements were to address both the coating design and the quality control associated with the application of such coatings.
• A methodology to calculate the range of CP along the pipeline length was included. The approach was included in DNV RP-F103 as a method of demonstrating that the voltage drop in the pipe wall was sufficiently low to ensure that the pipeline potential remained below (i.e. more negative than) the criterion for protection potential, thus ensuring effective CP. Instead of preparing a self-contained code.
- Coating Breakdown Factor
The most controversial factor in CP design for pipeline has been the coating breakdown factor. The standard CP design for Norwegian waters has been based on extremely conservative values up to 2003 and 2004 when the first revisions of DNV-RP-F103 and ISO 15589-2 were issued. DNVGL-RP-F103 recommends the calculation of individual coating breakdown factors for linepipe coating (Table A-2) and field joint coating (Table A-3), respectively. The primary purpose of this approach is to ensure that the CP design is adequate for the actual combination of coating systems to be applied and to take into account the actual surface area affected by field joint coating.
The coating breakdown factors recommended in DNVGL-RP-F103 sometimes result in significantly lower CP current demands than by use of coating breakdown factors in ISO 15589-2. This is important to enable CP of such pipelines to be based on anodes installed at adjacent structures. The lower coating breakdown factors for such coating systems are then justified by the more stringent requirements to coating design and quality control of coating materials and their application as defined in DNV-RP-F102 and DNV-RP-F106, being most significant for the more ‘advanced’ coating systems.
Certain combinations of parent and FJC systems are not addressed in ISO 15589-2. It is further noticeable that contrary to the RP, the ISO standard does not differ between the properties of a heat shrink sleeve (HSS) applied directly on a bare steel surface and a HSS applied on top of a heat cured LE system (min. thickness 100 µm). It is not practical to record pipeline coating breakdown factors and they are accordingly selected based on a (subjective) engineering judgment. In DNVGL-RP-F103 this fact is reflected by the use of coating breakdown constants differing by a factor of 3 (i.e. 0.00003, 0.001, 0.003, 0.01, 0.03).
If project specific conditions are considered to justify a more conservative design with respect to the expected ‘coating breakdown’ than recommended in the RP, it should be included either as a quantitative estimate of bare steel surface area (with CP current demands to be calculated using design current densities in DNV-RP-B40114) or by use of a ‘design factor’, k.
Chapter III
In-Line Inspection of Pipelines (ILS)
Pipelines are generally buried and therefore the outside pipe surface is not available for visual inspection. To overcome this restriction, tools have been developed to inspect the pipe wall thickness, position, and geometry from inside the pipeline, hence the reference to in-line inspection (ILI). A number of ILI tools have been developed and are still being developed to inspect for specific types of anomalies. Generally to obtain a complete assessment of the integrity of a pipeline several ILI tools must be run in succession and then the inspection records compared to identify the types, location and severities of anomalies detected. There are ILI tools that inspect for dents, corroded areas (metal loss), cracks both in the axial direction and in Percentages are based on OPS incident database information. The circumferential direction, and tools that define the location and geometry of the pipeline. These tools are inserted into an operating pipeline and used to inspect the pipe from the inside. They are moved by the flow of the product in the pipeline and can generally be run without removing the line from serviced , although the inspections usually involve carefully controlled conditions, which may reduce the flow in a pipeline.
In short these are some of the methods used in the [ILS] type of pileline inspection:
Metal Loss tools [MFL]
These tools use magnetic flux leakage inspection technology to look for areas of metal loss that have a circumferential extent. As shown in Figure 1, the MFL tool induces an axially oriented magnetic flux field into the pipe wall thickness. Sensors on the inside surface detect locations where the flux field is forced out of the pipe wall thickness by metal loss such as an area of corrosion on either the inside or outside surface. If no wall thickness reduction is present, the flux field remains in the pipe wall thickness and no signal is detected.
Ultrasonic Inspection
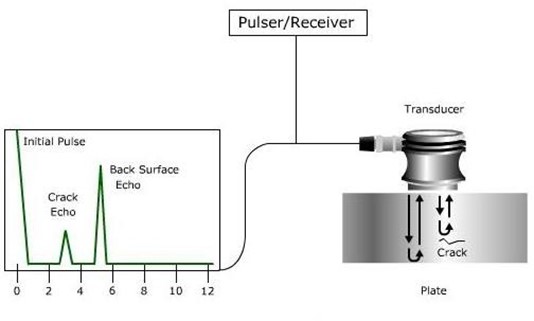
There are two general types of UT (ultrasonic) tools. One type inspects for metal loss, the other inspects for axial cracks in the pipe seam and pipe body (like SCC). These tools generally have to be run in a liquid medium to be able to couple the ultrasonic signal to the pipe wall thickness, which makes their use in a gas pipeline difficult. The tools detect metal loss by sending an ultrasound wave perpendicular to the inside wall thickness and measuring the time for the signal to be reflected from the inside and outside surfaces. Metal loss on either the inside or outside surface is detected by a change in the time of flight of the signal
EMAT [electromechanical acoustic transducer]
This technique uses magnetic and ultrasonic techniques to inspect a pipe for metal loss and cracks. This has been under development for at least 20 years and the main goal has been to inspect for axial cracks in the pipe.
Eddy current
This is another inspection technique that uses alternating current to induce magnetic fields into the steel pipe to detect cracks. To date, no in-line inspection tools using the eddy current technique have been developed for pipelines but a prototype is under development.
Ultrasonic Corrosion Inspection of Crude Oil Pipeline
One example would be that, an ultrasonic in-line inspection tool has successfully inspected a crude oil pipeline, which is 48-inches in diameter and 1287kms in length. This is one of the biggest crude oil pipeline systems in the world. The longest distance of a single inspection run is 1055 km. The ultrasonic instruments were upgraded and the new ultrasonic tool was built in 1995. The new ultrasonic tool has 512 ultrasonic transducers and the firing interval of each transducer is 1.6 ms (625 Hz). The specified criterion for the grading of the data collected by the ultrasonic tool is single transducer grading. This criterion requires that corrosion will be reported when a single transducer detects a metal loss. The data observation software for personal computers is supplied to show inspection results and measured data collected by the ultrasonic tool.
Detection Capability
Accuracy of Area Measurement Isolated corrosion pitting (,The length of the corroded area is less than 50 mm) ● Average accuracy of depth measurement * ().50 mm Localized corrosion (,The length is between 50 mm and 590 mm) ● Average accuracy of depth measurement * ().5() mm t Average accuracy of length measurement * 4.2o mm + Average accuracy of circumferential measurement * 10 mm General corrosion (The length is greater than 590 mm) + Average accuracy of depth measurement * ().5() mm + Average accuracy of length measurement * 4.2o mm ● Average accuracy of circumferential measurement * 10 mm Location Accuracy Longitudinal location ~ 0.2 m (from the preceding girth weld) Circumferential orientation * 15 degrees
Principle of Ultrasonic Measurement
One of the characteristics of the ultrasonic tools is to measure the remaining wall thickness directly, differing from the conventional magnetic flux leakage method. Figure 3 shows the principle of ultrasonic measurement. The ultrasonic tool calculates a water distance and remaining wall thickness of the pipe at every ultrasonic measurement during the inspection run. The water distance is defined as the distance between the tip of transducer and internal surface of the pipe. The ultrasonic transducer emits an ultrasonic pulse perpendicular to the pipe wall and receives echo signals from the inner surface and outer surface c)f the pipe. The ultrasonic tool measures the time interval (Ts) between the emission of the ultrasonic pulse (T) and the arrival of the surface echo (S) to calculate the water distance. It also measures the time interval (Tb) between the arrival of two echoes from the inner surface (S) and the outer surface (B) to calculate the remaining wall thickness. The velocity (Vi) of the ultrasonic pulse is measured on-site in crude oil used as the driving media.
As the ultrasonic pulse propagates 5900 m/s (Vs) in steel, the water distance (W) and the remaining wall thickness (R) can be calculated using the following equations:
W = V1 XTS R = Vs xTb
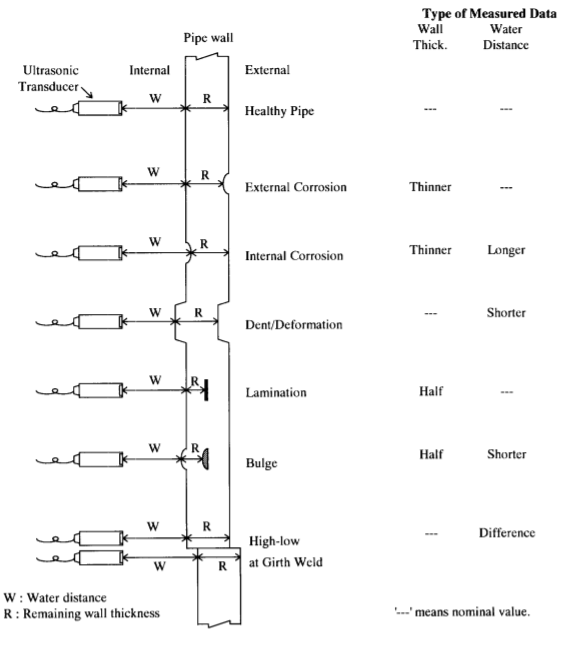
Figure 1.2 [Typical Detectable Anomalies]
Figure 1.1 shows typical detectable anomalies by the ultrasonic tool. As a result, the ultrasonic tool can detect not only metal loss corrosion on both the internal and external surface, but also dents, lamination, bulges, high-low at girth welds, and differentiate between them using the water distance and remaining wall thickness data.
The ultrasonic thickness meter measures the time interval between echo signals and calculates the water distance and remaining wall thickness. The firing interval of each ultrasonic transducer is 1.6 ms or 625 times per second. Odometer wheels measure the longitudinal location. A pendulum measures the circumferential location. After amplifying each signal by amplifiers, each signal is transferred to an encoder. The encoder is a main computer to control all instruments for data processing during the measurement run. The parameters of ultrasonic measuring mode on the encoder are set by a laptop personal computer before each inspection run. The encoder collects all data at predetermined time interval from the ultrasonic thickness meter, odometer, and pendulum. The encoder compresses the measured data and records them on data recorders. Digital data from the encoder is recorded on a magnetic cassette tape in the data recorder.
Pigging Works
All preparation works, on-site survey, data analysis and reporting are carried out based on the quality system of ISO 9001. Prior to mobilization of the ultrasonic tool, the client provides the current information regarding pipeline buckles or obstructions, and other significant changes in the physical operating characteristics that may have changed any previous survey run. After mobilization, the ultrasonic tool is inspected on site to assure that it is properly calibrated. A final examination of the ultrasonic tool is also made prior to insertion of the same into the launching facility. The ultrasonic tool is remotely turned a switch on after the launcher has been pressurized with crude oil. The client carries out cleaning pig runs through the pipeline periodically. However in order to obtain effective ultrasonic echo and reduce an effect of wax, a cleaning pig is launched just before launching the ultrasonic tool. The ultrasonic tool is launched by the client pursuant to standard launching procedures. The client maintains control of all pipeline systems and operations throughout the survey run. The client utilizes standard receiving procedures to remove the ultrasonic tool from the receiving facility. Once removed the ultrasonic tool is cleaned with hot water or solvent. The ultrasonic tool is visually inspected for mechanical damage and turned the switch off. After flushing, the ultrasonic tool is transported to the maintenance facility. At the end of each survey run, the magnetic tape data and instrumentation calibrations are checked to assure that the ultrasonic transducers, data recorders and other instruments have operated properly in the completed segment.
Data Interpretation
The qualified computer specialists analyze the measured data. The specified criteria for the grading of the data collected by the ultrasonic tool is single transducer grading. This criterion requires that corrosion will be reported when a single transducer detects a metal loss. The software is specially developed for this purpose and has been improved. The software has the capability to pickup anomalies from the measured data and makes a corrosion list and a pipeline features list. Reporting The final reports including a summary of the inspection data and corrosion list are submitted to the client. As the client has an as-built pipeline database, which provides the precise location of all girth welds, each measured girth weld is compared with the database by personal computers. After processing the measured data, the draft of the pipeline features list, which shows the locations of all girth welds, valves, and other pipeline features, is prepared. It is reviewed and revised, if necessary, by the computer specialists. After completion of the pipeline features list, the computers make the corrosion list. Each pipe joint from the upstream side is graded by the computers based on the girth weld locations in the pipeline features list. After processing the measured data, the draft c)f the corrosion list is prepared. It is reviewed and revised, if necessary, by the computer specialists. Interaction and Evaluation During the computer grading, the interaction between two or more corroded areas is considered. Two individual defects interact and are clustered when the axial and circumferential spacing between the corrosion edges is less than 50 mm. Each corrosion is evaluated by ASME B31G and 85% Area Method. The computers calculate the safe maximum operation pressure for the corrosion. The computer also calculates ERF (Estimated Repair Factor) to evaluate the corrosion. [1]
In addition to the hard copy of the final report, the data observation software UltraView for personal computers is supplied to show inspection results and measured data collected by the ultrasonic tool. Figure 2.1 show a sample of the summary view screen.
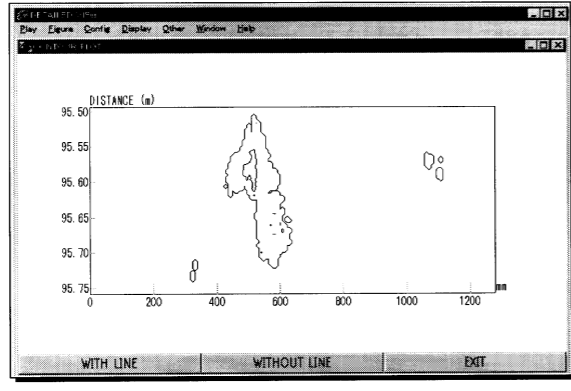
Figure 2.2 [Sample of Countour Plot Screen]
The main functions of the data observation software are as follows:
-Random access to the data output by reference to the weld stationing in the as-built database.
– Viewing and scrolling plan view of the data on a monitor.
-Viewing cross sections, longitudinal and circumferential on the monitor.
– Generating three dimensional and contour views.
– Perform on screen remaining strength calculations using B31G, 85% Area Method and RSTRENG methods for the highlighted area.
– Export raw data values from the data observation software consisting of station, orientation and remaining wall thickness in a text format.
- Magnetic Flux Leaking [MFL] Pipeline Inspection
MFL tools have proven to be reliable instruments for the assessment of pipeline integrity. Based on the Magnetic Flux Leakage principle, internal and external metal loss in the Pipe wall can be accurately detected. As a result of complete in-house development, Pipesurvey International now offers MFL inspection tools. These respond to the very latest standards of resolution, accuracy and reporting, and in addition hold a unique combination of tool capabilities.
Magnetic flux leakage (MFL) detection is one of the most popular methods of pipeline inspection. It is a nondestructive testing technique which uses magnetic sensitive sensors to detect the magnetic leakage field of defects on both the internal and external surfaces of pipelines.

Figure 3.2 [A MFL tool, comprising three main sections: a drive section at the front of the tool, a central magnetizer section and a data logger situated towards the rear of the tool]
Principle, Model and Influence Parameter
The basic idea of magnetic flux leakage inspection is that the ferromagnetic material is magnetized close to saturation under the applied magnetic field. If there is no defect in the material, most magnetic flux lines will pass through the inside of the ferromagnetic material; if not, because the magnetic permeability of the defect site is much smaller than that of the ferromagnetic material itself, magnetic resistance will increase in the defect area, so the magnetic field in the region is distorted. Magnetic flux lines will be bent, some will leak out of the material surface, and a magnetic leakage field will form at the defect area. By using magnetic sensitive sensors to detect the magnetic leakage field, the corresponding electrical signals can be obtained. Then the detected signals are analyzed so that the status of the defect can be determined. Defects caused by corrosion can appear in the interior and exterior surfaces of the pipeline, and magnetic flux leakage pipeline detection can detect them, but it cannot distinguish between internal and external defects. Therefore, a classification approach based on support vector machines (SVM) is presented to achieve defect discrimination . Sensors 2015, 15 4 material; if not, because the magnetic permeability of the defect site is much smaller than that of the ferromagnetic material itself, magnetic resistance will increase in the defect area, so the magnetic field in the region is distorted. Magnetic flux lines will be bent, some will leak out of the material surface, and a magnetic leakage field will form at the defect area. By using magnetic sensitive sensors to detect the magnetic leakage field, the corresponding electrical signals can be obtained. Then the detected signals are analyzed so that the status of the defect can be determined. Defects caused by corrosion can appear in the interior and exterior surfaces of the pipeline, and magnetic flux leakage pipeline detection can detect them, but it cannot distinguish between internal and external defects.
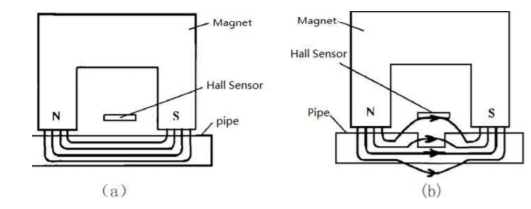
Figure 4.2. [Principle of magnetic flux leakage detection. (a) Pipe without metal loss; (b) Pipe with defect]
With the development of electronic technology, computer technology and sensors, magnetic field measurement methods have been developed greatly. The main methods include:
– Electromagnetic induction method. Based on Faraday’s law of electromagnetic induction, it is one of the most basic magnetic measurement methods. It can measure DC, AC and pulsed magnetic fields. Measuring instruments usually use induction coils, including impact galvanometers, flux meters electronic integrators and vibrating coil magnetometers
-Magnetic resistance effect method. This method utilizes the changing characteristics of material resistances under magnetic fields. The sensors with this effect mainly include semiconductor reluctance elements and ferromagnetic thin film reluctance elements
-Magnetic resonance imaging. By absorbing or radiating a certain frequency of electromagnetic wave in the magnetic field, some microscopic particles would induce resonance. The intensity of the magnetic field is obtained by measuring the degree of resonance. Due to different types of particle resonance, devices can be of various types, such as nuclear magnetic resonance magnetometers, electron spin resonance magnetometers, etc. The former is a measuring instrument with a constant magnetic field of the highest precision, so it can be used as a reference for magnetic transmission devices.
– Magneto optical method. This approach utilizes the magneto-optical and magneto-stricture effects. Optical fiber sensors based on this method have unique advantages, which include being usable in harsh environments
- EMAT – electromechanical acoustic transducer Inspection Tool
Another inspection method, would be through EMAT, which uses magnetic and ultrasonic techniques to inspect a pipe for metal loss and cracks. This has been under development for at least 20 years and the main goal has been to inspect for axial cracks in the pipe.
Pipeline deterioration by stress corrosion cracking (SCC) is an increasing challenge for the pipeline industry. Recent incidents and the lately issued OPS advisory bulletin in the U.S., emphasize the worldwide focus on this phenomenon. Coating disbondment is understood as a precursor to SCC by increasing the susceptibility of the pipeline for corrosion. The presented High Resolution ILI-technology, based on a novel concept of an Electromagnetic Acoustic Transducer (EMAT), allows both, the detection of SCC and the detection of disbonded coating, using two independent measurement methods. Thus, the technology combines proactive and reactive measures to improve the reliability of a pipeline that is susceptible to SCC.
The EMAT Crack Detection tool (ECD) is an unique ultrasonic inspection tool, combining EMAT sensors, designed for gas pipelines, and a high resolution concept with the rugged mechanical design and operational performance of established in-line inspection tools. The performance of the ECD tool has been proven on sample pipe containing SCC colonies at different locations.
The Concept of a high Resolution ILI- EMAT Technology
Electromagnetically generated ultrasound is a versatile technology, which allows a conceptual adaptation to the anticipated task. Therefore, the performance and reliability of an inspection tool based on EMAT technology depends strongly on the right choice of the EMAT wave mode and the design of the sensor device.
Guided-wave acoustics are used for SCC detection. The selected shear wave mode is operated at a rather low Utfrequency.
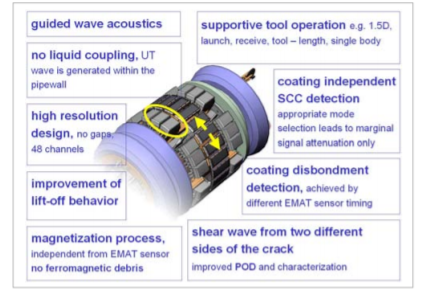
Figure 5.2 . [Advancements of high resolution EMAT In-line Inspection tool.]
The high resolution EMAT sensors are sensitive in the clockwise and counter-clockwise direction of the perimeter of the pipe. This interrogates inclined cracks from two different sides. The sampling rate and the circumferential separation of the EMAT sensors are determined by the physical size of the EMAT transducer itself, which in turn is a function of the pipeline diameter. The in-line inspection prototype is designed for 48 EMAT channels, evenly distributed around the circumference. The pulse sequence and the receiver timing allows each sensor to cover a distinct, and overlapping, area of the pipeline.
EMAT requires no couplant and uses guided waves to perform rapid, volumetric inspection for detection of pitting and wall loss
. • This system is set up for piping 6”–42” O.D. and .150”-.750” wall.
• Supports Axial and Circ. scanning modes using either Pulsed or Permanent magnets. • Provides A, B & C Scan displays with real time analysis
• At 6” per second, the EMAT pipe scanner will cover 360° of the pipe, identifying internal and external corrosion as well as other conditions
• Ability to scan through diamond wrap coating making it possible to inspect for damage under the coating.
The versatility of EMAT technology cannot be overstated. It can test structures through a variety of methods – thickness, angle beam, guided wave and phased array – while supporting configurations for Pulse Echo or Through Transmission with small transducers (for rapid, high-speed screening) or large transducers (for precise sizing). Another benefit is the fact the EMAT does not require the application of liquid couplant.
Inspection Capabilities
• Thickness • Corrosion • Touch Point • Interface/penetrations corrosion • Pitting • Erosion • Microbial Induced Corrosion (MIC) • Hydrogen Blistering • Cracking • Stress Corrosion Cracking (SCC) • Long Seam Cracking • Girth Weld Cracking • HAZ • Coating Integrity
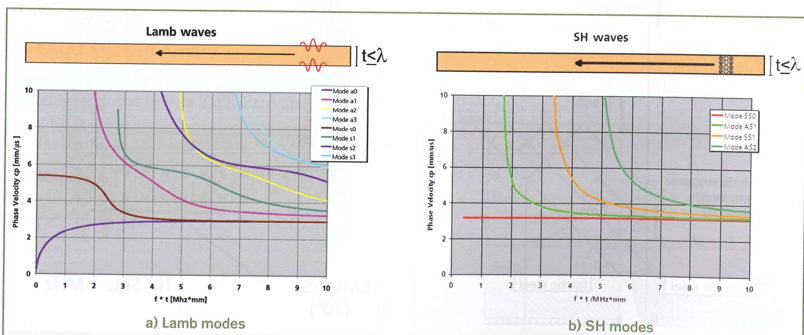
EMAT design for Lamb and SH modes
Both wave types can be very efficiently generated and detected by EMATs. For most of the applications discussed in this paper, two types of transducers are used, which differ from the well-known basic principles of EMAT angle probes for the SV waves and SH waves.
The classical design of an EMAT angle probe for Shear Vertical (SV) waves is to operate a meander-like wounded RF air coil in a homogeous magnetic field. To improve the mechanical protection of the RF coils the ddesign was develloped. The magnetic RF field of the coil is amplified due to the magnetic permeability and guided by the teeth of the comb structure to the bottom where the magnetic RF field induces the eddy currents in the same way as for the RF air coil.
EMAT SENSITIVITY AND SIZING
The minimum crack and crack colony dimensions in the pipe body specified for the EMAT technology are 40mm (1.58“) in length and 2mm (0.079”) in depth with a Probability of Detection (POD) of 90% [6]. The minimum crack dimensions in the longitudinal weld area are 40mm (1.58“) in length and 3mm (0.118”) in depth at 90% confidence interval. The depth and length sizing accuracy in the pipe body and the longitudinal weld area at 80% confidence and for the 20” pipelines are 0.95mm (0.037”) for depth and 10mm (0.394”) for length respectively. The sensitivity of the EMAT technology is influenced by the signal-to-noise-ratio of the time-integral of the EMAT echo amplitude. A sub-critical flaw can be detected if its effective cross section is above the detection threshold of the applied EMAT ILI sensor system.
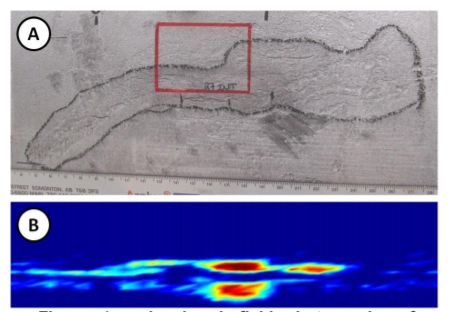
Figure 6.2 [showing in-field photography of a verified SCC colony after magnetic particle inspection (MPI) and corresponding EMAT data]
The crack length and interlinked length have been determined in-field by the MPI length and application of pipeline operator interlinking rule respectively. The colony shown in Figure 6.2 has been reported as a crack-like anomaly associated with corrosion at a depth of 34% and 52mm (2.047”) length. Coating disbondment and metalloss corrosion has been reported for this indication. The area and pipe steel were both determined as being highly susceptibile to SCC. Field verification confirmed the classification and sizing at 33% wall thickness depth, an MPI length of 225mm (8.858”) and an interlinked crack length of 27mm (1.063”). During semi-automated sizing of the indication, the analysts capture time and frequency of the EMAT signal which are used to determine the crack depth and length. Comparison of the EMAT and NDT phased-array ultrasonic (PA UT) depth shows only slight variation of the depth by 1% of the local wall thickness. The difference in length originates from the fact that the EMAT signal corresponds to the effective cross section of the corresponding anomaly at the EMAT detection threshold inside the pipe wall. As a consequence, the length determined from the EMAT signal corresponds to the maximum length of the anomaly at a depth equal to the detection threshold. [3]
Corrosion detection using EMAT has proved to be a fast accurate corrosion detection tool. In addition it has also turned to be economical for the asset owners. EMAT can now also be used for crack detection in process pipelines. It has also proved very successful for detecting SCC in process pipelines. It can also be used on tank shells, pressure vessels, heat exchangers and tube inspections.
- Eddy Current Corrosion Inspection
The eddy current technique is a tried and tested inspection method that can offer significant, practical advantages over other techniques in certain situations. For example, paint coatings and insulation need not be removed, as eddy current inspection is a noncontact method.
Corrosion is an undesirable feature, in varying degrees, of all metal structures and components. The detection of corrosion is a vital part of any in-service maintenance corrosion management program in all industrial sectors, from pipeline corrosion in the oil and gas sector to fuselage corrosion in the aerospace industry
Pulsed Eddy Current
Pulsed eddy current (PEC) differs from conventional eddy current in that the drive coil is excited by a broadband pulse rich in low frequencies, the range of frequencies of the pulse being dependent on its length. This generates a large amount of data and this must be handled by sophisticated sensors and processing capability. The sensors that have proved most suitable for the task are solid-state magnetic sensors such as Hall effect, giant magnetoresistive (GMR), and giant magnetoimpedance (GMI) sensors, all of which produce an output voltage that is directly proportional to the measured magnetic flux. They also offer a better signal-to-noise ratio at low frequencies compared with pickup coils. (With GMR sensors, the resistance drops dramatically as magnetic field is applied. In contrast, GMI sensors demonstrate a drop in impedance.)
Remote Field Eddy Current
The Remote Field Eddy Current (RFEC) inspection is an eddy current method to allow for inspection of ferromagnetic pipe. It has been pointed out by Teitsma that it is especially suitable for the inspection of non-piggable pipe. It has not been employed for in-line inspection mainly due to the reason, that the inspection speed is limited. For the inspection of unpiggable pipeline, however, often cable operated tools are employed. Cable-operated tools inspect at a much slower speed as compared to in-line inspection tools. Moreover, RFEC measurement is more forgiving with respect to lift-off and changing diameter. RFEC-tools have been used for the inspection of heat exchanger and pressure tubes and have been proposed to inspect pipelines for stress corrosion cracking. They have also been used to inspect the casing of oil and gas wells. Russel Technology has introduced commercial RFEC pigs. Their application in the oil and gas industry is restricted mainly due to the limitations in speed.
Pulsed Eddy Current
The idea of Pulsed Eddy Current (PEC) is to use a signal pulse. The propagation of such a pulse in a conductive material can be described as a diffusion process with a certain propagation speed. At the rear wall the reaction of the conductive layer suddenly stops. Measuring the diffusion speed to the rear wall allows for a quantitative wall thickness calculation. This is the idea of Pulsed Eddy Current (PEC), as it has been developed by Shell Global Solutions [5]. The accuracy of an ultrasonic probe is not being reached, but being an electromagnetic method, it does not require a couplant.
One pipe type that is still difficult to inspect is ferritic pipe with a non ferritic but metallic layer. In some configuration that metallic layer may be on the outside as in cladded riser pipe. In other configurations this cladding may be on the inside as in cladded pipe for sour service.
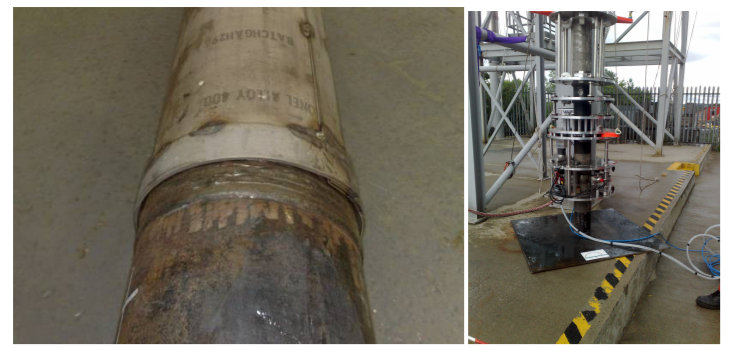
Figure 7.2 Monel cladded pipe on the left and an external inspection device made by Innospection
Often the task is to measure through the metallic layer into the ferritic layer of the pipe and to test for metal loss or crack-like defects. on the left side shows a sample test pipe with a cladding of Monel on the outside. For the detection of corrosion in the inner ferritic layer the conductive Monel layer would need to be overcome. Special eddy current configurations with respect to the above mentioned parameter allow finding these defects. What made this project especially difficult was the fact that defects had to be detected close to or within girth welds. As internal pigging and axial scanning from the outside usually leaves the weld uninspected or at least badly inspected, the direction of scanning has to be altered. A scanning movement in the circumferential direction will improve the situation considerably. For in-line inspection a circumferential movement is hardly possible. Hence an external inspection tool was designed to scan the pipe on the outside. This tool is shown on the right side of.
Eddy current non destructive testing really consists of a variety of different methods. All of these methods can be tailored for some application. In particular magnetically biased eddy current is suitable for many applications in the oil and gas industry. For In-line Inspection it offers unique opportunities. For instance cladded pipe or flexible riser pipe may be inspected.
Conclusion:
In short, the current status of research is that some gratifying results in theoretical and experimental studies have been achieved, but there is still no complete theoretical system; more qualitative analysis exists but the engineering using quantitative research work is less frequent; the defect contour description is still in the stage of laboratory research, and actual pipeline defect detection accuracy still needs to be further improved.
Pipelines are used in virtually every nation around the globe to transport oil and gas from the fields to the market. While pipes are cheaper than other means of transportation, this cost saving alternative comes with a major price: pipes are subject to cracks and corrosion which in turn can cause leakage and environmental damage. Oil spills, gas leaks, and their associated environmental problems have become a serious and major concern in the oil and gas industry, and consequently, this has led to significant losses in revenue, severe disruption of operations as well as a persistent threat to marine life and the ecosystem. This accidental discharge of petroleum products on/offshore has hitherto caused untold and unimaginable environmental hazards and economic loss that requires urgent remedial action and attention.
Therefore, the assessment of the integrity of a pipeline can be accomplished by assessing the defects that occur on the pipe, through pipeline inspection methods.
Bibliography:
- Authors: M. Kondo, M. Kobayashi and M. Kurashima Title: „Ultrasonic Corossion Inspection Of Crude Oil Pipeline”, Publisher: NKK Corporation, 1999, Yokohama, Japan.
Link: https://sci-hub.tw/https://www.onepetro.org/conference-paper/NACE-99525
- Author: Bob Eiber, Title: „Overview of Integrity Assessment Methods for Pipelines”, Publisher: Robert J. Eiber Consultant Inc 4061 Fairfax, 2003, Ohio.
Link: http://mrsc.org/getmedia/8B8FF358-4055-4D0E-9ED6-08AE41DA68B7/EiberOverview.aspx
- Authors: Chao Zhang, Maolin Cai, Guanwei Jia. Title: „Theory and Application of Magnetic Flux Leakage Pipeline Detection”, Published: School of Automation Science and Electrical Engineering, Beihand University, 2015, Beijing, China.
- Authors: Richard Kania, Stefan Klein, Jim Marr, Gabriela Rosca. Title: „ Validation of EMAT Technology for Gas Pipeline Crack Inspection”. Publisher: International Pipeline Conference, 2012, Alberta, Canada.
- Author: K. Reber. Title: „ Inspection of Unusual Pipe Types with Eddy Current Technologies”. Publisher: A. Bonisch, Innospection LTD, Aberdee, UK.
Link: https://ppsa-online.com/papers/10-Aberdeen/2010-08-Innospection.pdf
Reference List:
- Authors: M. Kondo, M. Kobayashi and M. Kurashima Title: „Ultrasonic Corossion Inspection Of Crude Oil Pipeline”, Publisher: NKK Corporation, 1999, Yokohama, Japan.
Link: https://sci-hub.tw/https://www.onepetro.org/conference-paper/NACE-99525
- Author: Bob Eiber, Title: „Overview of Integrity Assessment Methods for Pipelines”, Publisher: Robert J. Eiber Consultant Inc 4061 Fairfax, 2003, Ohio.
Link: http://mrsc.org/getmedia/8B8FF358-4055-4D0E-9ED6-08AE41DA68B7/EiberOverview.aspx
- Authors: Richard Kania, Stefan Klein, Jim Marr, Gabriela Rosca. Title: „ Validation of EMAT Technology for Gas Pipeline Crack Inspection”. Publisher: International Pipeline Conference, 2012, Alberta, Canada.


Responses